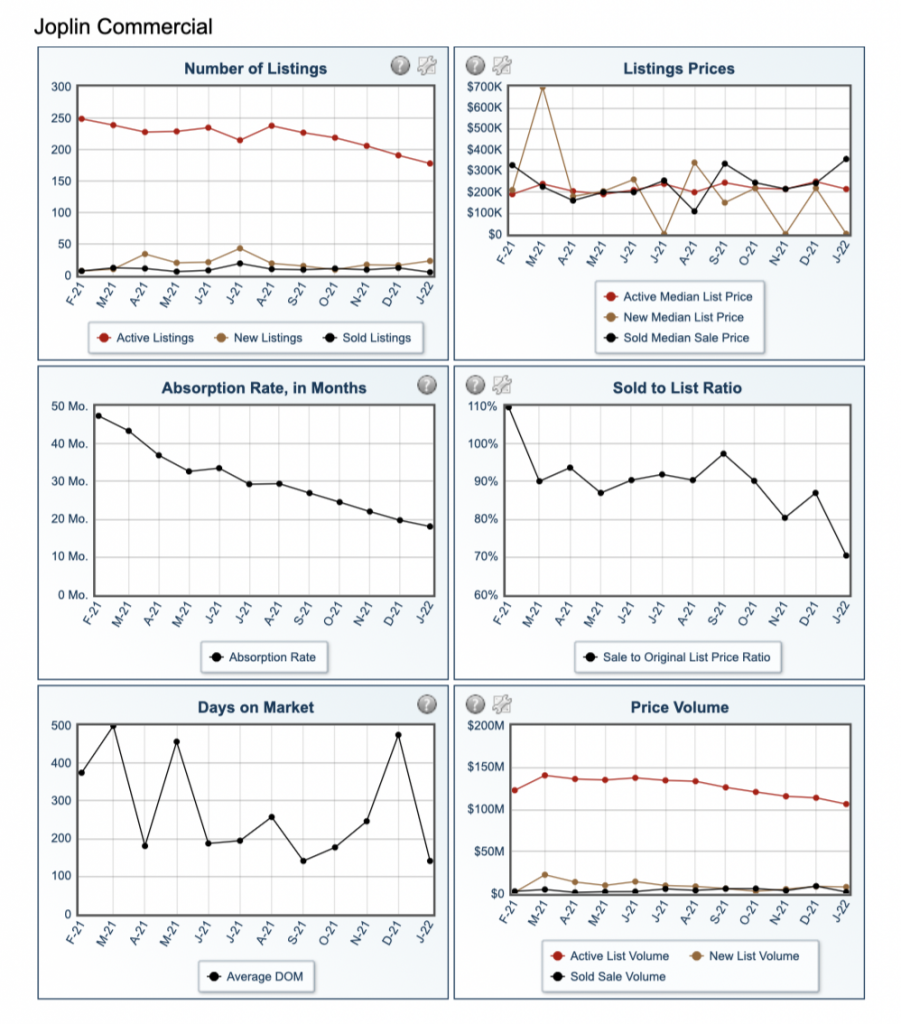
Our January report covers commercial real estate trends from our MLS – arming investors, tenants & brokers with the data to make smart decisions.

This report focuses on trends found in Ozark Gateway Association of Realtors Commercial Real Estate listings in January. We evaluate average price per square foot, occupancy, and other notable metrics. With this data, we hope to provide principles, tenants, and brokers alike with actionable understandings to make well-informed commercial real estate decisions.
Overall occupancy levels continue to rebound from 2020 lows.
All asset classes (except for multifamily) saw occupancy levels rise in the first month of the year. These numbers point to positive signs ahead for previously struggling property types, particularly for retail office assets, as more and more buildings see their tenants return to the workplace. Office properties saw occupancy rates grow by 3.4% in January.
Pricing patterns diverge across asset types.
Industrial properties for sale ended their pricing slump, finally seeing gains after experiencing downward movement since November 2020.
Multifamily prices continued to climb in January, rising by 7.33% and maintaining the growth it had experienced since early Q4 last year. However, the new listings hitting the market reveal dropping occupancy levels.
Office properties saw the most significant jump in pricing, with the average asking price per square foot jumping 12.35% from December to January.
New retail listings across both sales and lease experienced negative pricing pressures in January. Sales listings saw a more modest 3.46% decrease, while lease listings saw a more than 15% decrease from December rates.
Properties for lease surge in availability while rates decline.
January witnessed a surge of for-lease properties newly listed. At the same time, average asking rates per month saw a sharp overall decrease from December numbers — this decrease was larger than any monthly decline occurring in 2020.
Industrial assets for lease helped keep overall rates from a less dramatic drop. The asset class experienced a 4.5% increase in average asking prices per square foot as twice as many listings were added. In particular, warehouses represented a big draw for searching tenants.
Disclaimer: This article’s information is based on our internal marketplace data and additional external sources. While asking price in many ways reflects market conditions, variations in pricing are affected by changes in inventory, asset size, etc. Nothing contained on this website is intended to be construed as investing advice. Any reference to an investment’s past or potential performance should not be construed as a recommendation or guarantee towards a specific outcome.
